What is FFMI, and what does fat-free mass index measure?
Fat-free mass index divides lean tissue, not total weight, by height squared. This guide covers the formula, the 1.80 m height correction, and a worked example in metric with imperial equivalents.
JCVerified Verified by Jobi Cheriyan, Founder & Builder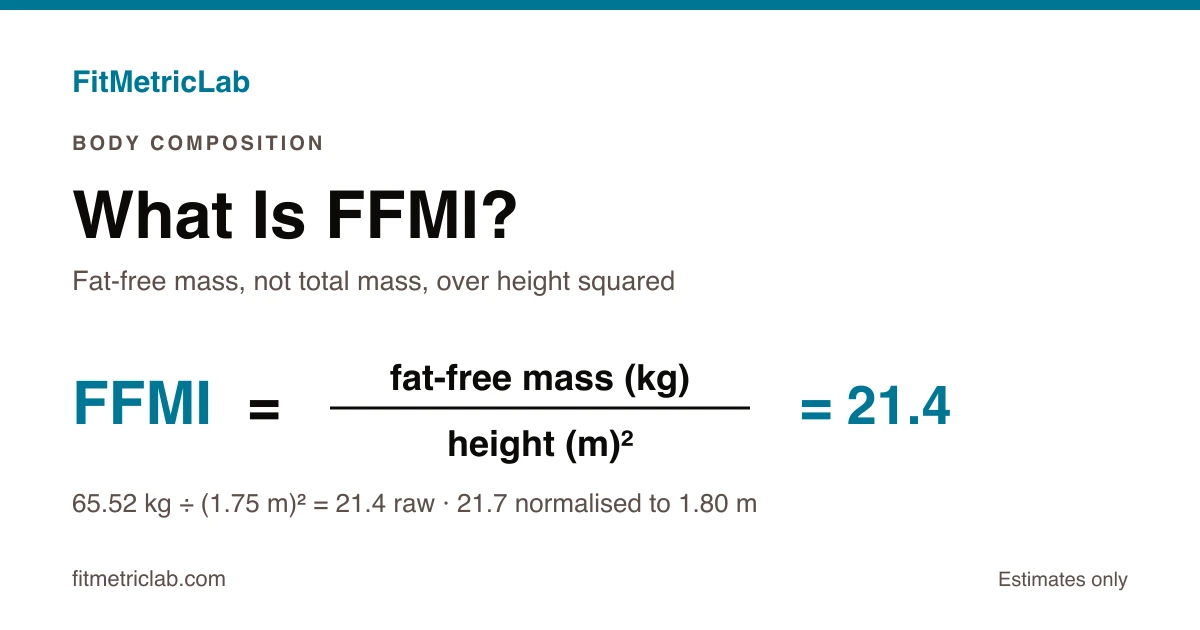
Two adults can weigh 78 kg (172 lb), stand 1.75 m (5 ft 9 in), and record an identical BMI of 25.5. Their lean tissue can still differ by almost 11 kg (24 lb). One of them trains. The other has never lifted anything heavier than a laptop bag. BMI cannot separate them, because it only ever sees total weight.
What FFMI is comes down to one substitution. The FFMI calculator divides lean tissue by height squared rather than total body mass, which is exactly where those two bodies come apart. This guide covers the definition, the formula and its 1.80 m height correction. It then works through an example in metric with imperial in brackets, three scenarios where the number behaves unexpectedly, and the points at which it misleads.
What is FFMI?
FFMI stands for fat-free mass index. It describes how much tissue that is not fat a body carries relative to its height, using the same height-squared denominator BMI uses. Fat-free mass covers muscle, bone, organs, connective tissue and body water, so the index tracks lean bulk rather than muscle on its own.
Height squared does the levelling work. A 1.60 m (5 ft 3 in) frame and a 1.95 m (6 ft 5 in) frame carry different absolute amounts of tissue at the same build. Dividing by height squared puts both on one scale. The output is a single figure in kg/m2, and for most adults it lands somewhere between the mid-teens and the low twenties.
Why the index matters
BMI answers one question well: how heavy is this person for their height. It cannot separate a 90 kg (198 lb) rower from someone of the same height and weight who has never trained. FFMI splits that single figure into the part that responds to training and the part that responds to diet.
Two properties make it useful. The index stays comparable across heights, so a training log kept over years is not distorted by comparison with a taller partner. It also moves independently of fat, so a stretch where the scale holds steady while composition shifts still registers as a change.
Population data exist for context. Schutz, Kyle and Pichard measured 5,635 apparently healthy adults in Switzerland by bioelectrical impedance and published FFMI percentiles by age and sex. Median FFMI among 18 to 34 year olds came out at 18.9 kg/m2 in men and 15.4 kg/m2 in women. Across the older age bands in that sample, male FFMI barely moved while fat mass rose. A stable BMI reading hides that shift completely.
BMI describes how much mass a body carries. FFMI describes what kind.
How FFMI is calculated
Three inputs drive the calculation: body mass, height, and body fat percentage. The body fat figure splits mass into its fat and fat-free parts. Height squared then normalises the lean figure so bodies of different sizes compare fairly.
Fat mass (kg)      = Body mass (kg) x Body fat % / 100
Fat-free mass (kg) = Body mass (kg) - Fat mass (kg)
FFMI               = Fat-free mass (kg) / Height (m)^2
Normalised FFMI    = FFMI + 6.3 x (1.80 - Height (m))
Where:
- Body mass = total weight in kilograms; pounds divided by 2.205 gives kilograms
- Body fat % = the share of mass that is fat, from skinfold calipers, bioelectrical impedance or a DXA scan
- Fat-free mass = everything that is not fat: muscle, bone, organs, connective tissue, water
- Height = standing height in metres, or feet and inches converted to metres
- FFMI = the raw index, expressed in kg/m2
- Normalised FFMI = the raw index restated at a reference height of 1.80 m (5 ft 11 in)
Kouri and colleagues added the 6.3 correction because a height-squared denominator does not fully cancel height. Taller people tend to score slightly lower at a comparable build, and the correction pulls every score back to a common reference.
A worked example
Take an adult of 78 kg (172 lb), standing 1.75 m (5 ft 9 in), with body fat measured at 16%.
- Fat mass: 78 x 0.16 = 12.48 kg (27.5 lb)
- Fat-free mass: 78 - 12.48 = 65.52 kg (144.4 lb)
- Height squared: 1.75 x 1.75 = 3.0625
- Raw FFMI: 65.52 / 3.0625 = 21.4
- Height correction: 6.3 x (1.80 - 1.75) = 0.315, giving a normalised FFMI of 21.7
Run the same mass and height through a BMI calculator and the answer is 25.5. That sits a shade above the 25.0 line most charts draw at the top of the healthy band. The FFMI of 21.4 describes where that mass sits rather than how much of it there is.
Entering the same three inputs into the fat free mass index calculator returns 21.4 raw and 21.7 normalised. Every figure in this article was computed from the formulae above and rounded only at the last step. Intermediate values therefore differ slightly from a calculation rounded at each stage.
How to use the FFMI calculator
The FFMI calculator takes body mass, height and body fat percentage, and returns fat mass, fat-free mass, raw FFMI and normalised FFMI. Units toggle between metric and imperial, so kilograms and metres or pounds and feet both work without hand conversion.
The body fat input carries the whole calculation, and most people estimate it rather than measure it: where no figure is to hand, the body fat percentage calculator (navy method) derives one from tape measurements at the neck, waist and hips. The companion guide on how to measure body fat percentage covers the method and its error margins in full.
On reading the output: the raw value is the plain arithmetic, and the normalised value is the one that lines up with published reference figures and with comparisons across heights. Mixing the two is the most common way people misread the result.
Common scenarios
The FFMI vs BMI comparison is the clearest place to start. The index also behaves unexpectedly across heights, and when the scale refuses to move at all.
FFMI vs BMI at identical weight
Two people at 78 kg (172 lb) and 1.75 m (5 ft 9 in) both register a BMI of 25.5. At 16% body fat, the first carries 65.52 kg (144.4 lb) of lean tissue, for an FFMI of 21.4. At 30%, the second carries 54.6 kg (120.4 lb), for an FFMI of 17.8. A gap of 3.6 index points sits entirely invisible to BMI.
Comparing across heights
A 92 kg (203 lb) athlete stands 1.90 m (6 ft 3 in) at 14% body fat. That gives 79.12 kg (174.4 lb) of lean tissue and a raw FFMI of 21.9, higher than the 21.4 above. Apply the correction, 6.3 x (1.80 - 1.90) = -0.63, and the normalised figure is 21.3 against the shorter person's 21.7. Height alone flipped the ranking.
The scale that will not move
An adult of 70 kg (154 lb) at 1.68 m (5 ft 6 in) goes from 28% to 24% body fat with weight unchanged. BMI reads 24.8 throughout. Fat-free mass rises from 50.4 kg (111.1 lb) to 53.2 kg (117.3 lb), and FFMI from 17.9 to 18.8. The index records what the scale does not.
| Body | Body fat | Fat-free mass | BMI | Raw FFMI | Normalised FFMI |
|---|---|---|---|---|---|
| 78 kg (172 lb), 1.75 m (5 ft 9 in) | 16% | 65.52 kg (144.4 lb) | 25.5 | 21.4 | 21.7 |
| 78 kg (172 lb), 1.75 m (5 ft 9 in) | 30% | 54.60 kg (120.4 lb) | 25.5 | 17.8 | 18.1 |
| 92 kg (203 lb), 1.90 m (6 ft 3 in) | 14% | 79.12 kg (174.4 lb) | 25.5 | 21.9 | 21.3 |
| 70 kg (154 lb), 1.68 m (5 ft 6 in) | 28% | 50.40 kg (111.1 lb) | 24.8 | 17.9 | 18.6 |
| 70 kg (154 lb), 1.68 m (5 ft 6 in) | 24% | 53.20 kg (117.3 lb) | 24.8 | 18.8 | 19.6 |
Rows three and one are the case for normalising. Raw FFMI ranks the taller athlete higher, 21.9 against 21.4; the correction reverses that to 21.3 against 21.7. Whichever value is quoted, it has to be the same one on both sides of a comparison.
Common mistakes and misconceptions
- Treating the output as a measurement. FFMI inherits every error in the body fat input. Moving body fat from 13% to 19% on the 78 kg (172 lb) example swings FFMI from 22.2 to 20.6. That spread of roughly 1.5 points comes from the measurement method alone.
- Borrowing percentiles across populations. The widely quoted percentile tables describe adults of European descent in Switzerland. Hull and colleagues later found FFMI differs across racial and ethnic groups in a multi-ethnic sample of 1,339 adults. A percentile drawn from one population does not transfer cleanly to another.
- Mixing raw and normalised values. Reference figures published for normalised FFMI do not apply to raw scores, except at exactly 1.80 m (5 ft 11 in), where the two are identical.
- Reading the number as muscle. Fat-free mass includes bone, organs and body water. Hydration alone moves it day to day, so a single reading taken after a hard session is noisier than it looks.
- Treating 25 as a verdict. Kouri and colleagues studied 157 male athletes, of whom 74 denied steroid use. Normalised FFMI in that subgroup extended up to a limit of 25.0, while many of the 83 users exceeded it. Body fat came from skinfold calipers, the sample was small and self-reported, and the authors themselves called the findings preliminary. It is a group observation from 1995, not a test that returns a verdict on any individual.
Related calculations
FFMI sits inside a small cluster of body-composition figures, and the others answer questions it leaves open.
- Lean body mass calculator: reports the fat-free figure in kilograms or pounds, without the height adjustment, which suits tracking absolute change
- How to calculate BMI. The same height-squared denominator applied to total mass, which is the contrast FFMI is read against
Frequently asked questions
What is FFMI in plain English?
FFMI is fat-free mass index, a single number describing how much tissue that is not fat a body carries for its height. The calculation strips fat out of body mass, leaving muscle, bone, organs and water, then divides that figure by height in metres squared. Population medians for adults aged 18 to 34 sit near 18.9 kg/m2 in men and 15.4 kg/m2 in women, and trained athletes cluster well above those figures. The output is an estimate, because the body fat percentage behind it is itself an estimate rather than a direct measurement.
How does FFMI differ from BMI?
BMI divides total body mass by height squared, so muscle and fat count identically towards the result. FFMI divides only the fat-free portion by that same denominator, which separates the two. In the worked example above, an adult of 78 kg (172 lb) at 1.75 m (5 ft 9 in) records a BMI of 25.5 and an FFMI of 21.4. BMI alone cannot distinguish that person from someone of identical weight and height carrying nearly 11 kg (24 lb) less lean tissue. The two indices answer different questions, and neither replaces the other.
Why does FFMI need a height correction?
Dividing by height squared removes most of the effect of height, though not all of it. Taller people tend to score slightly lower on raw FFMI at a comparable build, so Kouri and colleagues added a correction of 6.3 multiplied by (1.80 minus height in metres). That restates every score as though the person stood 1.80 m (5 ft 11 in) tall. At exactly that height the correction is zero and the two values match. A person of 1.75 m (5 ft 9 in) gains 0.315 points; a person of 1.90 m (6 ft 3 in) loses 0.63.
Does FFMI apply to women?
The arithmetic is identical regardless of sex: fat-free mass divided by height squared, with the same optional height correction: what differs is the distribution of results. Women typically carry a higher proportion of essential fat and record lower FFMI values than men of comparable training history. Published medians for young adults run 15.4 kg/m2 against 18.9 kg/m2. Figures drawn from male samples do not transfer across. The 1995 dataset behind the widely quoted ceiling of 25 comprised 157 male athletes and nobody else.
Sources and methodology
The formula and its 6.3 height correction come from the 1995 paper that introduced the index. The reference medians and percentiles come from a large Swiss adult sample, and the caution about applying those percentiles across populations comes from later multi-ethnic work. Every worked figure above was recomputed from the formulae rather than copied from a source.
- Kouri, Pope, Katz and Oliva (1995), Fat-free mass index in users and nonusers of anabolic-androgenic steroids, Clinical Journal of Sport Medicine
- Schutz, Kyle and Pichard (2002), Fat-free mass index and fat mass index percentiles in Caucasians aged 18 to 98 y, International Journal of Obesity
- Hull, Thornton, Wang and colleagues (2011), Fat-free mass index: changes and race/ethnic differences in adulthood, International Journal of Obesity
Putting it together
FFMI takes the one thing BMI cannot supply: a body fat figure. It uses that figure to split weight into the part that shifts with training and the part that shifts with diet. The arithmetic is trivial. The interpretation is where the care goes.
The number inherits the error of whatever measured body fat, and it counts bone and water alongside muscle. Its reference percentiles belong to specific populations. The widely quoted ceiling of 25 describes a small 1995 sample rather than a verdict on a person. Read as a tracking metric for one body over time, or as a fair comparison across heights once normalised, it does a job no scale reading manages on its own.
Last updated 28 July 2026.