What Is a MET Metabolic Equivalent?
A MET expresses activity intensity as a multiple of resting energy use. This guide covers the definition, both conversion routes to kilocalories, a fully worked example landing at 172 kcal, and the three separate reasons two honest calculators disagree on the identical session.
JCVerified Verified by Jobi Cheriyan, Founder & Builder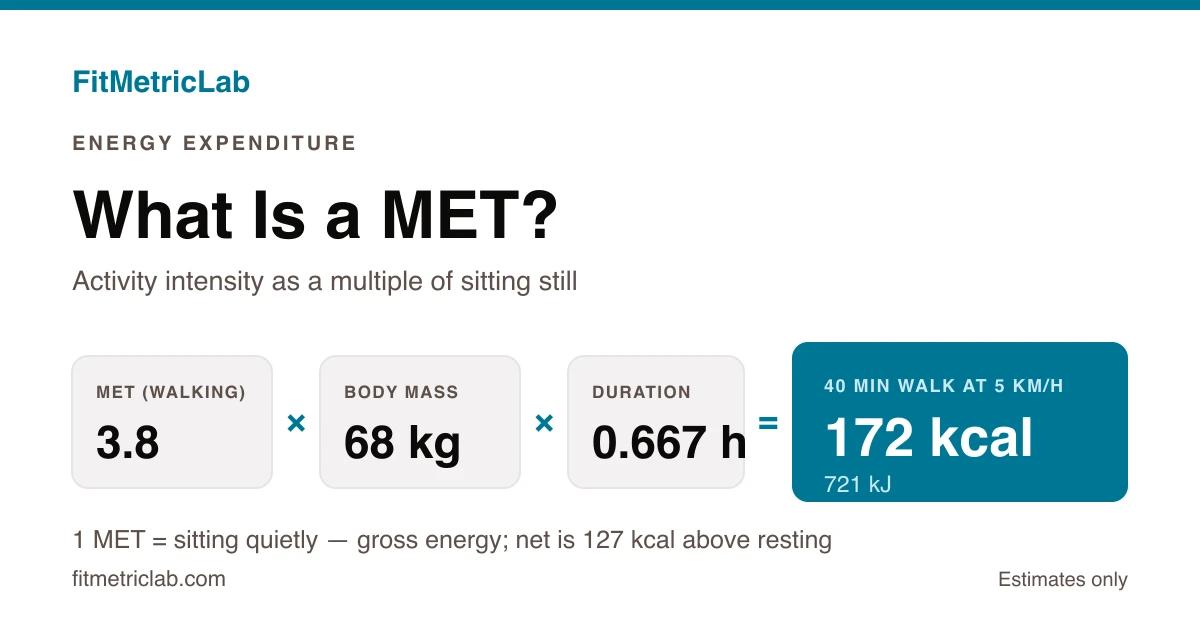
One 40 minute walk, three tools, three answers: 172 kcal, 181 kcal and 127 kcal. Nothing is broken and nobody has made an arithmetic slip. All three ran the same intensity rating through a different convention, and that rating is a MET.
Understanding what is a MET metabolic equivalent, and what the scale quietly assumes about your body, is the difference between reading an activity estimate well and reading it badly: what follows is the definition, the arithmetic, a fully worked example, and the places the whole thing stops holding. The custom activity MET calculator handles the sums once the logic is clear.
What is a MET metabolic equivalent?
A metabolic equivalent of task, MET for short, expresses the intensity of an activity as a multiple of resting energy use. One MET is the cost of sitting quietly. The Compendium of Physical Activities pins that down in two equivalent ways: an oxygen uptake of 3.5 millilitres per kilogram of body mass per minute, or 1 kcal per kilogram of body mass per hour. An activity listed at 4 METs runs at roughly four times resting intensity.
The design decision that makes the scale useful is what it leaves out. Body mass is stripped from the published number, so one figure describes an activity for a 50 kg person and a 100 kg person alike. Mass is added back later, at the point where intensity becomes energy. That is why MET tables travel across countries, laboratories and decades without being re-measured for every population that picks them up.
The same decision explains the scale's central limitation, which the rest of this article keeps circling back to. A number built to be universal cannot also be personal.
Where the numbers actually come from
These ratings are not derived from theory. They come from people breathing into equipment in laboratories while researchers measure oxygen consumption, a technique called indirect calorimetry. Those measurements get pooled, averaged and published as a reference table.
That table is the Compendium of Physical Activities, first published in 1993 and updated in 2000, 2011 and 2024. The current edition, the 2024 Adult Compendium, catalogues 1,114 activities across 22 major headings, each with a five-digit code. Of those, 912 carry measured values and 202 remain estimates, so roughly 82 per cent rest on real oxygen data rather than inference. The 2011 edition managed 68 per cent, which is a meaningful jump in a decade.
Two details matter more than they first appear. The 2024 edition is scoped to adults aged 19 to 59, with separate compendia for youth aged 6 to 18 and for adults aged 60 and over, because resting metabolic rate shifts across the lifespan and a single baseline was papering over that. And the Compendium's own compilers state plainly that it was not built to determine the energy cost of activities within an individual. A calorie figure for your particular walk is exactly the use they flagged as outside the original scope.
That catalogue sits underneath a large share of fitness apps, research questionnaires and public health surveillance worldwide, which is why unrelated tools return suspiciously similar numbers for the same activity. They are usually reading from the same book.
The intensity bands
Public health guidance defines activity intensity directly in METs rather than in speeds or heart rates, which lets one threshold cover swimming, gardening and stair climbing at once. The 2024 Compendium sets out four bands:
Sedentary: 1.0 to 1.5 METs: sitting, reclining or lying while awake
Light: 1.6 to 2.9 METs: slow walking, standing tasks, light housework
Moderate: 3.0 to 5.9 METs: brisk walking, easy cycling, doubles tennis
Vigorous: 6.0 METs and above: running, singles tennis, fast cycling
The World Health Organization uses the same 1.5 MET ceiling to define sedentary behaviour, qualified by posture: energy expenditure at or below 1.5 METs while sitting, reclining or lying down. Standing still is low intensity but not sedentary under that definition, which is the technical reason standing desks get discussed separately from exercise.
These bands are also where the widely quoted activity targets come from. WHO guidance framed as 150 to 300 minutes of moderate activity per week, or 75 to 150 minutes of vigorous activity, is a MET statement wearing ordinary clothes. Either half of that pairing describes the same weekly intensity total, which is the idea the MET minutes scenario below makes explicit.
How MET calorie burn is calculated
The MET calorie formula runs in three moves. Multiply the MET value by 3.5 to get oxygen uptake in millilitres per kilogram per minute. Multiply by body mass for the absolute uptake. Then convert oxygen into energy at approximately 5 kcal per litre and scale by duration. Collapsed into one line:
kcal per minute = (MET × 3.5 × body mass in kg) / 200

Total kcal = kcal per minute × duration in minutes
Where:
- MET = the published intensity rating for the activity, dimensionless
- 3.5 = assumed resting oxygen uptake, in ml per kg per minute
- Body mass = in kilograms. From pounds, divide by 2.205; from stone, multiply by 6.35
- 200 = the millilitre-to-litre conversion combined with the energy value of oxygen
- Duration = minutes of activity, not elapsed clock time. A 60 minute gym visit with 15 minutes of standing around is a 45 minute entry
- Result = kilocalories, printed as Calories with a capital C on North American food labels, and as kilojoules across Australia, New Zealand and much of Asia at 1 kcal = 4.184 kJ
Every part of that is arithmetic except the first line. Choosing the MET value is the only step requiring judgement, and it is where most of the error enters.
Two formulas, two slightly different answers
A shorter version of the same calculation circulates widely, and it is the one the Compendium itself prints:
Total kcal = MET × body mass in kg × duration in hoursThis route uses the 1 kcal per kg per hour half of the MET definition. The longer route uses the 3.5 ml per kg per minute half. In principle those are the same statement. In practice they are not quite, because 3.5 ml per kg per minute converted through the standard energy value of oxygen works out at about 1.05 kcal per kg per hour, not 1.00.
The gap is roughly 5 per cent, and it runs in a consistent direction: the oxygen route returns the higher figure. Both versions of the MET calorie formula appear in published tools, both are defensible, and neither is a mistake. It is simply the first of several reasons two honest calculators disagree on identical inputs. FitMetricLab's tools use the Compendium route, so every headline figure in this article is the kind a calculator on this site will reproduce. The oxygen route is worked through alongside it so the assumptions underneath stay visible.
A worked example, start to finish
Priya weighs 68 kg (150 lb, 10 st 10 lb) and walks for 40 minutes at 5 km/h (3.1 mph) on level, firm ground. The 2024 Compendium lists walking at 4.5 to 5.5 km/h (2.8 to 3.4 mph) on a firm surface, moderate pace, at 3.8 METs. That is code 17190, if the exact entry matters.
FitMetricLab's tools use the Compendium's own conversion, so that is the route worked through here:
Step one, convert the duration to hours. 40 / 60 = 0.667 hours.
Step two. Multiply the three inputs. 3.8 × 68 × 0.667 = 172.27.
Step three: round once, at the end. That gives 172 kcal (721 kJ).
Now the same walk down the oxygen route, which is the version most textbooks print. Multiply the MET value by 3.5 for oxygen uptake per kilogram: 3.8 × 3.5 = 13.3 ml per kg per minute. Multiply by body mass: 13.3 × 68 = 904.4 ml per minute, or 0.9044 litres of oxygen every minute. Divide by 200 to convert to energy: 4.522 kcal per minute. Multiply by duration: 4.522 × 40 = 180.88, or 181 kcal.
There is the 5 per cent gap, in one worked example, and there are two of the three numbers from the opening paragraph. Neither is a mistake. The 172 figure is the one the calculator returns, because that is the conversion the Compendium itself publishes.
Gross energy and net energy
The third number needs a different distinction. Priya's 172 kcal is gross energy: everything her body used during those 40 minutes, including the energy she would have spent sitting on the sofa instead. At 1 MET, 40 minutes of sitting costs her about 45 kcal. Subtract it and the net cost of choosing to walk is nearer 127 kcal.
The net figure sits about 26 per cent below the gross, and the gap is one of the most common sources of confusion between a calculator and a wearable. Calories burned from METs are almost always reported gross by calculators. Many watches and fitness apps report net instead, sometimes labelled active calories. Comparing one against the other and concluding that a device is inaccurate mistakes a definitional difference for a measurement error.
Neither figure is the right one in general. Gross answers what the body spent. Net answers what the activity added. The useful habit is knowing which one a given tool is showing, which is why the calculator prints both.
When the table itself moves
Here is a wrinkle rarely mentioned in guides to this subject. The 2011 Compendium listed that same moderate-pace walk at 3.5 METs, not 3.8, over a slightly narrower speed band. Run Priya's walk at the older value and it returns 159 kcal instead of 172.
A quiet revision to a reference table moved the answer by 14 kcal, about 8.6 per cent, without anything changing about Priya, her walk, or the physics involved. The 2024 update adjusted 176 existing MET values in the same way and added 303 new activities. Any tool built on the older edition and never updated still returns the older number, correctly, from a superseded source.
Three separate explanations for a discrepancy, then, before individual physiology enters the picture at all: which formula, gross or net, and which edition. A 40 minute walk that could reasonably be reported as 127, 159, 172 or 181 kcal was never going to be a precise measurement.
Using the Custom Activity MET Calculator
The custom activity MET calculator takes three inputs: a MET value, body mass in kilograms or pounds, and duration in minutes. It returns calories burned from METs in both kilocalories and kilojoules, and separates the gross figure from the net figure above resting.
The MET field carries all the judgement. Compendium entries are specific about speed, gradient, surface and load, and picking the entry that matches what actually happened beats picking the right sport. Walking spans 2.3 METs for a slow stroll to 8.5 METs at 5.0 to 5.5 mph, all under the same one-word label.
Where a standard pace band covers the activity, the dedicated tools skip the lookup entirely. The running calorie burn calculator and the walking calorie burn calculator assign pace-specific values automatically. The custom tool earns its place for everything the standard bands miss: uphill entries, load-carrying codes, occupational activities and sports without a speed field.
Common scenarios
The same session at two body masses
One hour of brisk walking at 4.8 METs returns 264 kcal for a 55 kg (121 lb) walker and 456 kcal for a 95 kg (209 lb) walker. The ratio between those outputs is 1.73, which is the mass ratio to two decimal places, because mass enters the formula as a straight multiplier.
The formula's proportionality is exact. The underlying physiology is not quite so tidy, and the Compendium's own documentation on corrected METs notes that the standard 3.5 baseline tends to sit above measured resting rate, with the resulting distortion larger in people who are heavier, older or less fit.
Comparing unlike activities
A 58 kg (128 lb) runner covering 30 minutes at 10 km/h (6.2 mph), rated 9.3 METs, lands at 270 kcal (1,129 kJ). That pace band and its alternatives are broken down in the guide to how many calories running burns. An 82 kg (181 lb) cyclist riding for an hour at 20 km/h (12.4 mph), rated 8.0 METs, lands at 656 kcal (2,745 kJ).
The cyclist's total is well over double, despite the lower intensity rating. Mass and duration are doing that work, not the MET value: when the question is which activity is harder rather than which session cost more, the activity calorie comparison calculator holds body mass and duration constant so the intensity difference is the only thing left moving.
Weekly volume in MET minutes
Research and surveillance rarely count sessions. They total intensity across a week in MET minutes, calculated as MET value multiplied by minutes. Brisk walking at 4.8 METs for 30 minutes on five days gives 720 MET minutes. Reaching the same total at 9.3 METs takes about 77 minutes.
Seventy-seven minutes of running against 150 minutes of walking, for the same weekly total. That ratio is the arithmetic behind the familiar convention that a minute of vigorous activity counts double towards weekly targets. The rule of thumb is not arbitrary; it falls out of the MET table.
Where the scale breaks down
- Treating a MET value as a measurement of you. It is a group average published to one decimal place, and that decimal place lends it a precision it does not carry for any individual. Body composition, sex, age, fitness, technique and running or cycling economy all move the true cost without moving the published value at all.
- Ignoring the 3.5 assumption. Measured resting oxygen uptake in adults frequently sits nearer 2.6 ml per kg per minute, so the standard baseline can overstate resting rate by around a third for many people. Every figure downstream inherits that.
- Mixing gross and net. Covered above, and worth repeating because it is the single most common apples-to-oranges comparison in this area.
- Confusing intensity with volume. METs describe how hard, not how long. A 12 MET sprint held for 90 seconds costs far less total energy than a 4 MET walk sustained for an hour.
- Using a generic activity label. Cycling ratings run from 3.5 at a gentle 5.5 mph to 16.8 for competitive racing. Picking the entry matching actual pace matters far more than picking the right sport.
- Applying adult values outside the adult range. The 2024 Adult Compendium covers ages 19 to 59. Separate compendia exist for youth and for adults aged 60 and over precisely because the shared baseline does not hold across those groups.
Frequently asked questions
What is a MET metabolic equivalent in simple terms?
A MET, short for metabolic equivalent of task, is a ratio. It compares the energy the body uses during an activity with the energy it uses sitting quietly. One MET is defined as an oxygen uptake of 3.5 millilitres per kilogram of body mass per minute, which the same convention treats as 1 kcal per kilogram per hour, or about 4.2 kJ. An activity rated at 6 METs therefore runs at roughly six times resting intensity. The number describes intensity and nothing else. It says nothing about duration, and it is not a measurement taken from any particular body. Multiplying the MET value by body mass and by time is what turns an intensity rating into an energy estimate.
How many calories does 1 MET burn per hour?
By the standard convention, 1 MET costs about 1 kcal per kilogram of body mass per hour, so a 68 kg (150 lb) person sitting quietly for an hour sits at roughly 68 kcal (285 kJ). The oxygen route gives a slightly higher answer. Converting 3.5 ml per kilogram per minute through the standard energy value of oxygen works out at about 1.05 kcal per kilogram per hour rather than exactly 1.00, which puts the same hour nearer 71 kcal. The gap is around 5 per cent and it appears in every calculation built on either route. Both conventions are in published use, which is one clean explanation for two calculators disagreeing slightly on identical inputs.
Are MET values the same for everyone?
No. A MET value is a population average drawn from laboratory measurement of groups of adults, then published as a single number for a named activity at a named speed. Resting metabolic rate varies with body composition, age, sex and fitness, and measured resting oxygen uptake in adults often sits closer to 2.6 ml per kilogram per minute than the 3.5 the scale assumes. The standard convention therefore tends to overstate resting rate for many people, and that error carries through into any calorie figure built on it. The 2024 Adult Compendium is scoped to ages 19 to 59, with separate compendia for youth and for adults aged 60 and over.
Why does my watch show a different calorie number?
Wearables rarely use a plain MET lookup. Most blend heart rate, accelerometer data, entered body mass and a proprietary model, and many report net energy above resting rather than the gross total a MET calculation produces. Those two definitions alone differ by around 45 kcal across a 40 minute session for a 68 kg person, before any modelling differences. Terrain, load carried, wind, temperature, technique and individual movement economy all shift the true cost without shifting the published MET value. Both numbers are estimates built on different assumptions, so comparing sessions against themselves on one device tends to be more informative than chasing agreement between devices.
Do MET values account for the calories burned after exercise?
No. MET values cover the activity window only. Elevated oxygen consumption continues after hard sessions, an effect usually labelled EPOC, and published reviews place it somewhere around 6 to 15 per cent of the net oxygen cost of the exercise itself. It is real and it is smaller than most marketing around it suggests. Any MET-based figure excludes it entirely, which means the estimate sits slightly low for high-intensity intervals and heavy resistance work, and is close to complete for steady moderate activity. The separate guide to calories burned lifting weights works through what the afterburn is realistically worth.
Sources and methodology
The MET definition, the intensity bands and every activity value quoted here come from the Compendium of Physical Activities, in its current form as the 2024 Adult Compendium. The 2024 Adult Compendium paper by Herrmann and colleagues in the Journal of Sport and Health Science documents the third update, covering 1,114 activities for adults aged 19 to 59, of which 912 carry measured values.
Specific values used: walking at 2.8 to 3.4 mph on a level firm surface at 3.8 METs (code 17190); brisk walking at 3.5 to 3.9 mph at 4.8 METs; running at 6.0 to 6.3 mph at 9.3 METs; and bicycling at 12 to 13.9 mph at moderate effort at 8.0 METs. The 3.5 MET figure attributed to the 2011 edition is that edition's value for the corresponding walking entry.
Discussion of individual variation and the 3.5 ml/kg/min baseline draws on the Compendium's corrected METs documentation, which sets out both the case for adjusting the standard baseline using measured resting metabolic rate and the objections to doing so. The oxygen-uptake form of the calculation follows ACSM's Guidelines for Exercise Testing and Prescription. The sedentary threshold and activity guidance follow the World Health Organization guidelines on physical activity and sedentary behaviour. EPOC figures come from the review by LaForgia, Withers and Gore in the Journal of Sports Sciences.
Headline figures use the Compendium conversion, MET × body mass (kg) × duration (hours), which is the route FitMetricLab's tools apply; oxygen-route figures are labelled as such where they appear. All arithmetic was computed at full precision and rounded once, at the end. Conversions use 1 kg = 2.20462 lb, 1 stone = 6.35 kg, and 1 kcal = 4.184 kJ.
Putting it together
A MET is a ratio, not a reading. It compresses an activity into a single intensity number by assuming a resting cost of 3.5 ml of oxygen per kilogram per minute, and every figure built on top inherits that assumption along with the population average underneath it.
The patterns hold better than the numbers do. Body mass scales the total in direct proportion. Duration matters more than intensity for most recreational sessions. Gross sits above net by the resting baseline, reliably. Those relationships stay true regardless of which convention or which edition produced the headline figure.
Read as a consistent unit of comparison, the scale does what it was designed to do in 1993: put a swim, a hill walk and a gym session on one axis. Read as an account of energy spent, it promises more than the measurement behind it can support. Running a session through the custom activity MET calculator and reading gross against net makes the size of that gap visible, which tends to be more informative than the headline number on its own.
Last updated 8 August 2026.