How to calculate lean body mass from weight and body fat
Lean body mass is total weight minus stored fat. This guide walks through the subtraction method, the Boer and Hume prediction equations, and a full worked example in metric with imperial equivalents.
JCVerified Verified by Jobi Cheriyan, Founder & Builder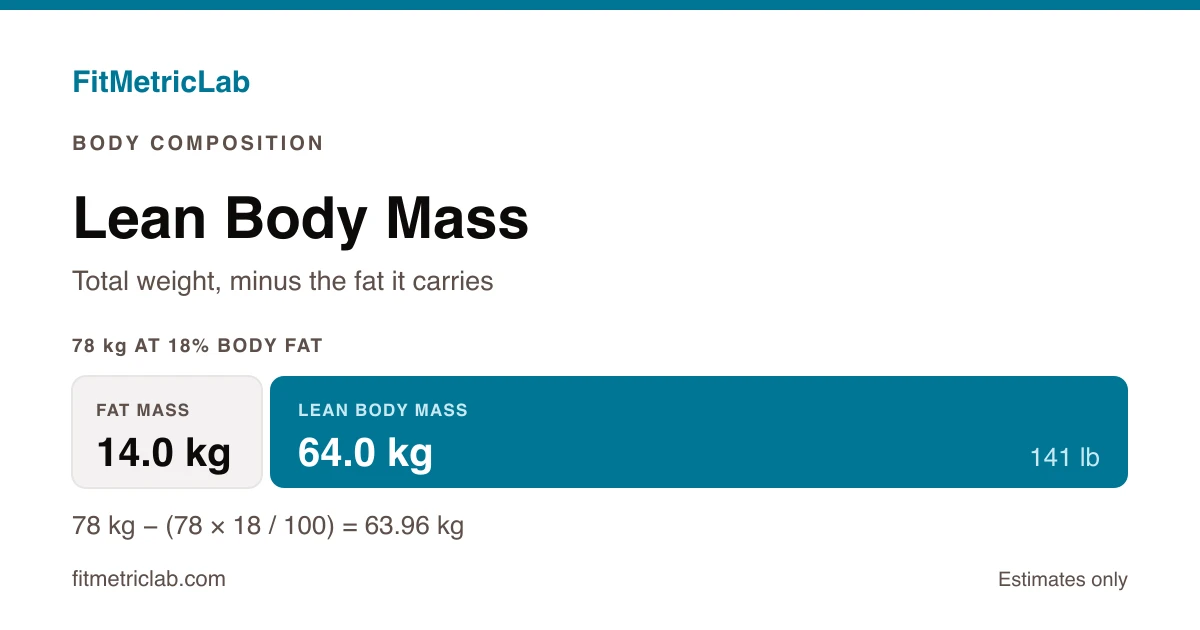
A person weighing 78 kg (172 lb) at 18% body fat carries roughly 64 kg (141 lb) of lean tissue. That single figure feeds most of the other numbers on a training log, from resting energy expenditure to fat-free mass index. Knowing how to calculate lean body mass turns a scale reading into something more informative than total weight. The lean body mass calculator handles the arithmetic in one step.
Two people at the same weight can differ by 10 kg (22 lb) of muscle, bone and water. This guide covers what the metric describes, the two families of formula used to estimate it, a full worked example, and the errors that most often distort the result. Every figure here is an estimate produced by a population equation, not a tissue measurement.
What is lean body mass?
Lean body mass is total body weight minus the weight of stored fat: what remains is skeletal muscle, bone, organs, skin, connective tissue and the water distributed through all of them. It is reported in kilogrammes (pounds in the United States, and often stone and pounds in the United Kingdom and Ireland).
The term sits alongside fat-free mass, which strictly excludes every gram of fat including the small essential fraction inside cell membranes and the nervous system. In practice most calculators and papers treat the two labels as interchangeable.
Why the number matters
Body weight on its own compresses two different tissues into one reading. A 2 kg (4.4 lb) change over a month means something quite different depending on whether it came from fat stores or lean tissue. Splitting weight into its lean and fat components is what makes a trend interpretable.
The figure also acts as an input elsewhere. Resting metabolic rate equations of the Katch-McArdle type are driven by lean mass rather than total weight, on the reasoning that lean tissue accounts for most resting energy turnover. Protein intake in the sports science literature is sometimes expressed per kilogramme of lean mass rather than total body weight. Clinical dosing of certain drugs uses lean mass for the same reason, which is why the prediction equations described below were developed in the first place.
How to calculate lean body mass
Two routes exist, and they answer slightly different questions. The first subtracts measured fat from measured weight, so it needs a body fat percentage from somewhere. The second predicts lean mass from height, weight and sex using a regression equation fitted to a reference population, and needs no body fat measurement at all.
The first lean body mass formula is the simpler of the two, and it is the one the calculator on this site applies:
Fat mass (kg)        = Total body mass (kg) x Body fat % / 100
Lean body mass (kg)  = Total body mass (kg) - Fat mass (kg)
The prediction route replaces that measurement with a formula. The Boer equations, published in 1984 and still widely cited, take this form:
Boer, men:    LBM (kg) = 0.407 x mass (kg) + 0.267 x height (cm) - 19.2
Boer, women:  LBM (kg) = 0.252 x mass (kg) + 0.473 x height (cm) - 48.3
Where:
- Total body mass = weight in kilogrammes (lb), taken under consistent conditions
- Body fat percentage = fat as a share of total mass, a unitless percentage
- Fat mass = the stored fat portion in kilogrammes (lb)
- Height = standing height in centimetres (in), used only by the prediction equations
- Lean body mass = the result, in kilogrammes (lb)
The coefficients differ by sex because average body composition differs by sex at the same height and weight. Feeding pounds or inches into these equations without converting first produces a number that looks plausible and is badly wrong.
A worked example
Take an adult male, 78 kg (172 lb) and 180 cm (71 in) tall. His body fat percentage is 18%, estimated from a body fat percentage (Navy method) tape measurement.
Step 1, fat mass. 78 x 18 / 100 = 14.04 kg, or 14.0 kg (31 lb) of stored fat.
Step 2, lean body mass. 78 - 14.04 = 63.96 kg, which rounds to 64.0 kg (141 lb).
Step 3, cross-check against a prediction equation. Boer for men gives 0.407 x 78 + 0.267 x 180 - 19.2 = 31.75 + 48.06 - 19.2 = 60.6 kg (134 lb).
The two methods differ by 3.4 kg (7.4 lb) for the same person. Neither is wrong in any absolute sense. The subtraction result reflects one tape-based body fat estimate with its own error band. The Boer result reflects a 1984 equation fitted to a reference population, and it never saw this person's body fat at all.
A third equation, Hume, returns 57.1 kg (126 lb) from the same height and weight, which shows the spread between published formulas rather than any instability in the person.
Downstream, the 64.0 kg figure produces a fat-free mass index of 19.7 when divided by the square of height in metres, 1.80 m (5 ft 11 in) here. It also gives a Katch-McArdle resting metabolic rate of about 1,750 kcal (7,330 kJ) per day. Both inherit the uncertainty in the lean estimate.
The lean figure is only as precise as the body fat percentage feeding it. An error of three percentage points in body fat moves the result by more than 2 kg (4.4 lb) on an 80 kg (176 lb) adult.
How to use the Lean Body Mass Calculator
The lean body mass calculator takes two inputs, weight and body fat percentage, and applies the subtraction method above. A unit switch handles kilogrammes or pounds, so no conversion is needed before entering a figure. The body fat percentage comes from wherever one is available, whether a tape measurement, a skinfold reading or a smart scale.
The output is lean body mass in the selected unit, with fat mass as the remainder of total weight. Reading it well means treating the figure as the centre of a range rather than a point. Recording the same measurement conditions each time, such as first thing in the morning before eating, keeps successive readings comparable.
The Boer and Hume equations are not part of the tool. They exist for the case where no body fat figure is available at all, and where a rough lean estimate from height and weight is better than nothing.
Two adjacent tools rest on the same subtraction. The FFMI calculator normalises lean mass for height, and the BMR calculator (Katch-McArdle) converts it into a resting energy estimate. Both derive lean mass internally from the same weight and body fat inputs, so a shift in the body fat figure moves all three results together.
Common scenarios
A runner through a training block
A distance runner drops 3 kg (6.6 lb) across twelve weeks. Splitting the change shows whether the loss came from fat stores or from lean tissue, and the second pattern is the one that tends to accompany a large energy deficit. Weight alone reports the same 3 kg either way.
A lifter in a gaining phase
Someone adding weight deliberately gains both tissues. Tracking lean mass, and its height-normalised form, separates the portion of the gain that reflects trained tissue from the portion that does not. Gains in lean mass slow markedly as training age increases, so month-to-month changes get smaller over time.
Mixed units across countries
A reader in the United Kingdom may weigh in stone and pounds, 12 st 4 lb in the example above. A reader in Canada or Australia works in kilogrammes, and a reader in the United States uses pounds. Converting to kilogrammes and centimetres before applying any formula by hand avoids the most common source of a nonsensical result. Food energy labelling varies the same way, with kilojoules alongside Calories in Australia and New Zealand.
Common mistakes and misconceptions
- Treating an estimate as a measurement. Every route here returns a modelled value. Quoting 63.96 kg rather than roughly 64 kg implies a precision that no tape measure or regression equation supports.
- Mixing units inside the formula. The Boer and Hume coefficients expect kilogrammes and centimetres. Entering 172 instead of 78, or 71 instead of 180, returns a figure that is wrong by tens of kilogrammes.
- Reading water shifts as tissue change. Glycogen stores bind water, so a high-carbohydrate day, a hard session or mild dehydration can move the lean figure by more than a kilogramme in either direction within 24 hours.
- Comparing outputs from different methods. A lean figure from a tape measurement and one from a prediction equation are not interchangeable, as the worked example shows. Following a trend means holding the method constant.
Frequently asked questions
What is a normal lean body mass?
There is no single normal figure, because lean body mass scales with height, frame size, sex and training history. A taller person carries more lean tissue than a shorter person at the same body fat percentage, which is why raw kilogrammes mean little on their own. Fat-free mass index, which divides lean mass by height squared, exists precisely to make the number comparable between people of different sizes. Population surveys typically report broad ranges rather than targets. The more useful reading is the trend in one person over months. A rising or falling lean figure at a stable body weight indicates a change in composition that the scale alone hides.
Is lean body mass the same as muscle mass?
No. Lean body mass covers everything that is not stored fat, so it includes skeletal muscle, bone, organs, connective tissue and the water held in all of them. Skeletal muscle is usually somewhere near half of it in an adult, though the share varies. That distinction matters when reading a change over a short period. Water shifts from a high-carbohydrate meal, a hard session or dehydration move the lean figure by a kilogramme (2.2 lb) or more, with no change in muscle tissue. Estimating muscle mass specifically requires imaging or specialised equations, not the simple subtraction used here.
How accurate are lean body mass formulas?
Accuracy depends on which input the formula uses. Subtracting fat mass from total mass is only as good as the body fat percentage feeding it. A circumference or skinfold estimate carrying an error of three or four percentage points passes that error straight through. Height and weight formulas such as Boer or Hume sidestep body fat measurement entirely. They were fitted to reference populations, so they drift on people far from that average, including lean athletes and people carrying substantial fat mass. Both approaches produce estimates rather than measurements, and the gap between two methods on the same person is often several kilogrammes.
Can lean body mass be calculated without a body fat percentage?
Yes. Prediction equations return a lean mass estimate from height, weight and sex alone. They appear in clinical settings where drug doses are scaled to lean tissue rather than total weight. The Boer and Hume equations are the two most commonly cited. They are quick and need no tape measure or callipers. They cannot distinguish between two people of identical height and weight who differ sharply in composition. A lean athlete and a sedentary person of the same build receive the same answer: where a reasonable body fat percentage is available, the subtraction method usually tracks an individual more closely.
Sources and methodology
The subtraction arithmetic and the worked example above were recomputed from the formulae rather than carried over from a source. The prediction equations are quoted in their published form, with coefficients unchanged.
- Boer P (1984), American Journal of Physiology: estimated lean body mass as an index for normalisation of body fluid volumes in humans, the original source of the Boer equations.
- Hume R (1966), Journal of Clinical Pathology: prediction of lean body mass from height and weight, volume 19, pages 389 to 391, the source of the alternative equation used as a cross-check.
Both are peer reviewed and apply across populations rather than to any single country.
Putting it together
Lean body mass converts one ambiguous number, total weight, into two components that can be read and tracked separately. The subtraction method tracks an individual most closely where a reasonable body fat percentage exists, and how that percentage is measured sets the precision of everything downstream. The prediction equations cover the case where no such measurement is available. The worked example produced 64.0 kg (141 lb) by one route and 60.6 kg (134 lb) by another for the same person, which fairly illustrates the precision on offer. Holding one lean body mass formula and the same measurement conditions constant, then following the trend over months rather than days, is what the lean body mass calculator supports.
Last updated 29 July 2026.